Running Seaside Traffic Light
This example is based on the Traffic Light Packaging Seaside Traffic Light Single Module Packaging Example. The Seaside Traffic Light example displays a traffic light on a website. The packaging example ends up with a reduced runtime image named seasideTrafficLight.icx. This runtime image contains information needed to launch the interactive debugger. The purpose of this example is to both run and debug the example.
For more see Running a packaged image.
The only difference between the Seaside Hello World and Seaside Traffic Light examples is the name of the icx file on the command line and the URL in the web browser.
Launching in Development Environment
The instructions here are sufficient to launch the seasideTrafficLight.icx from the directory in which the packager created it.
For Windows: esvio -lCON -iseasideTrafficLight.icx -ini:abt.ini
For Linux (UNIX): esnx -iseasideTrafficLight.icx -ini:abt.ini
Launching in VAST Runtime
The instructions here are sufficient to launch the seasideTrafficLight.ics from a VAST Runtime
See Running a packaged image for how to get the VAST Runtime.
Copy the reduced runtime image, seasideHelloWorld.icx, into the root of the VAST Runtime tree.
Copy <server-runtime-root>\newimage\esvio.ini (abtnx.ini for UNIX) to the same directory as the packaged image, seasideHelloWorld.icx, and rename it seasideHelloWorld.ini
Open a command terminal, cd to <server-runtime-root>.
Launch the image from the command line.
For Windows: bin\esvio.exe -lCON -iseasideTrafficLight.icx
For Linux (UNIX): newimage/abtnx -iseasideTrafficLight.icx
Browse page
See Running Seaside Hello World for information on setting up your Seaside-based server application, running it, and stopping it.
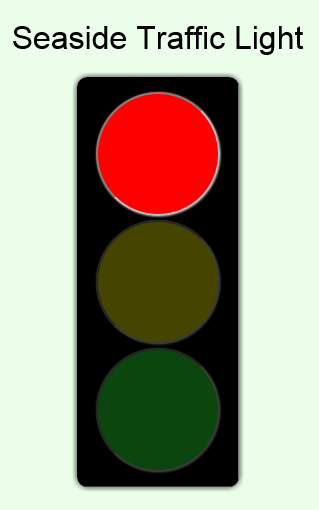
To see the website, start a web browser on the URL http://localhost:7777/trafficlight . It should look something like this:

To be sure Seaside is running, click the red and yellow buttons to update which is lit. Do not click on the green light since code executed in reaction to the mouse click will start a debugger.
Debugging
This section describes tools available to debug Smalltalk errors triggered while a server application runs. These tools include the interactive debugger and the stack dump debugger.
The interactive debugger (aka XD Debugger) is similar to the traditional Smalltalk debugger. From the XD Debugger you can change methods, and run incrementally. From the interactive debugger Transcript, you can evaluate Smalltalk code within the context of the image running on the target system. You can open XD inspectors and workspaces to the same as from the interactive debugger Transcript. When you are finished with the interactive debugger, you can disconnect it from the target image.
The stack dump debugger is an extension of the traditional Smalltalk debugger which allows the debugger to examine a stack dump (sdf) file with all its live objects.
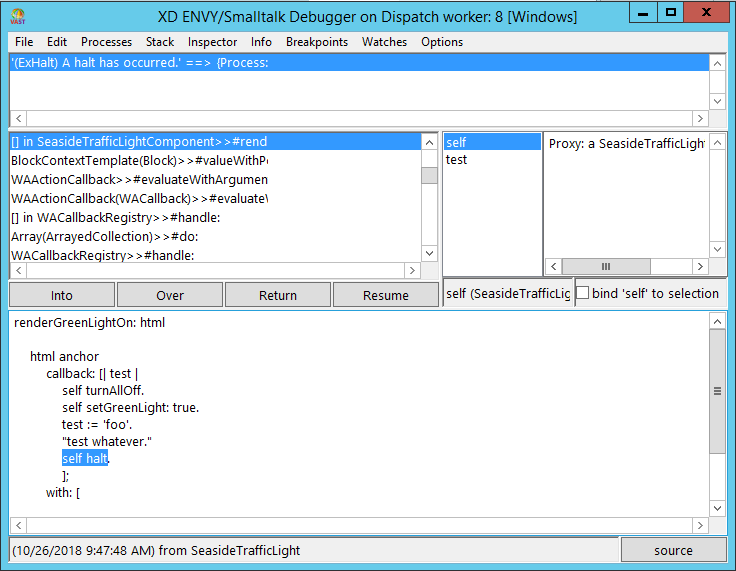
The Seaside Traffic Light example has a halt in the display code for displaying the green light. The halt triggers an interactive debugger if one such can be found. Otherwise, the halt triggers a stack dump.
Before triggering the debugger, verify the interactive debugger has all the things it needs to start.
1. The development image you used to generate the reduced runtime image should be present and open on the same machine as you are running this Seaside Traffic Light example.
Now, click on the green light. First, a new message displays in the command window
Process reportError: (ExHalt) A halt has occurred.
Then you will notice an XD Debugger opens in your passive development image. The [Windows] in the title bar is the name of the passive image. If you do not, consult Troubleshooting.

1. Using the “browse hierarchy” from the context menu in the interactive debugger, open a class hierarchy browser on SeasideTrafficLightComponent. Comment out the halt statement, save it and return to the interactive debugger to resume execution from the interactive debugger.
Observe that the green light turns on.
2. Now click each of the yellow, red and green lights in turn. No interactive debugger should open, and each light should light up in turn.
3. When you are done experimenting, Disconnect the interactive debugger from the target image.
4. Observe the method SeasideTrafficLightComponent>>#renderGreenLightOn:. It will be loaded in the passive image, but not the development image. If you want to retain the changes, save the change by saving the development image.
Stop the Seaside example by closing the command window.
Troubleshooting
This section covers situations which prevent an interactive debugger from opening or fulfilling its full functionality.
Cannot find interactive debugger
If the remote debugger in the target environment cannot find the interactive debugger in the development environment, you will see an error in the command terminal in which you started the traffic light example. The error below occurred when the development image was present but closed.
Process reportError: (ExHalt) A halt has occurred.
Cannot establish communication with '127.0.0.1' because the following error occured: Cannot connect due to error: ECONNREFUSED (10061): Connection refused
Dumping Stack File seasid00.sdf ...
Fatal Application Error: Exit due to error: 62 - Exit due to error with stack dump provided
The .sdf file can be read in the stack dump debugger. The other symptom of a missing interactive debugger appears in the Internet browser. Instead of the traffic light, a host not found error will appear.
The most common reasons for the host not found error
•Packaging problems: remote debugging must be enabled; the connection between the target and development must be established within the runtime image, and the workstation on which the interactive debugger is to open must be properly identified.
•Network problems: the workstation cannot be seen, or cannot be accessed.
•Absence of a VA Smalltalk installation or of a development image on the workstation.
Action:
1. Open the image from which the traffic light example was packaged. Stop the traffic light example and restart it. Trigger the error again
Or
2. Open the image from which the traffic light example was packaged. Read the sdf file using the stack dump debugger.
The most common reason for the connection refused error
•Development image not up and running
Cannot find passive image that matches target image
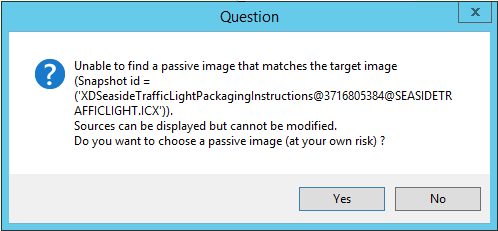
If the remote debugger in the target environment finds a possible development environment running, but cannot verify is the passive image that was used to package the reduced runtime which triggers an error, you will see the following dialog:

Note that this dialog may open minimized.
Action:
1. Repackage the example, close the packager and either leave the image open or save the passive image, close it, and re-open it to run the example.
Or
2. Click Yes and choose the passive image desired from the list presented. So long as the Smalltalk code for the server application is loaded, you will be able to debug packaged code and change it.
The most common reason for the dialog
•Not saving the passive image used to package after packaging is complete. (Not saving is best practice)
•Use of an image other than the one used to package. This is OK so long as the proper Smalltalk code is loaded from your project.
Cannot save Smalltalk method in interactive debugger
If you alter and save a method from the interactive debugger, (see how) you may get a walkback. This walkback will show up in the top pane as an additional process.
For the traffic light example, you may see the following in the command terminal:
Process reportError: CompiledMethod does not understand developer
or
Process reportError: ProcessorScheduler does not understand stsBrowserIcon
Action:
1. Check to see if the class and method is updated in a class hierarchy browser. If this is the case, the new method will be executed when you resume the debugger. You should terminate the new process.
2. Try disabling the VA Assist Pro from Transcript. You should terminate the new process.
3. If a method edition already exists, you may be able to load that edition from the interactive debugger and then resume the debugger. Changing a method edition seems not to have an effect, but this is because the interactive debugger does not update; it holds on to the method in the stack.
Or
1. Open a browser on the method and change it there.
After taking these actions, simply resume the debugger
The most common reason
•The passive image in which the Smalltalk method was manually chosen when the “Cannot find passive image that matches target image” dialog was opened.
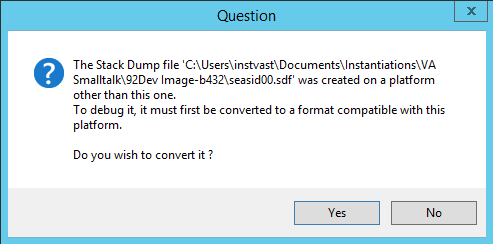
Stack Dump Debugger cannot load stack

Action:
1. Click No and choose the passive image desired from the list presented. If the stack is loaded, the warning was overly cautious.
The most common reason for the dialog
•Happens rarely.
Clearing out Seaside state
If you are getting bad result and would just like to get back to a clean situation, here are some things to consider:
•Steps documented in the Seaside Hello World example
•In the passive image, disable and enable remote debugging.
Last modified date: 04/18/2022